Last week I had a post go viral. My hits went into the stratosphere, and traffic to my blog went up by a factor of almost 1,000. I know this is my 15 minutes, and they’re fading fast. So, while I still have some elevated traffic, I thought I’d re-blog a few older posts, to see what happens.
Number form synesthesia or: why is there a kink at 20?
Whenever I think of numbers, I form a mental image in my head. This is not a conscious process; it happens consistently and involuntarily. For example, whenever I imagine the numbers 1 through 100, I see something like this:

You will note several interesting features of this mental map. Firstly, there is always a 90° left turn at the number 20; there is always a 90° right turn at the number 100. These two kinks are the only kinks in my mental number line; the lines are perfectly straight before zero and after 100. Why the kinks are there is mysterious.
Notice also that the image is not to scale. That is, 50 occurs half-way between 20 and 100 (why isn’t 60 there instead?)
Here’s another mental map I have, one that appears whenever I imagine a person’s age:
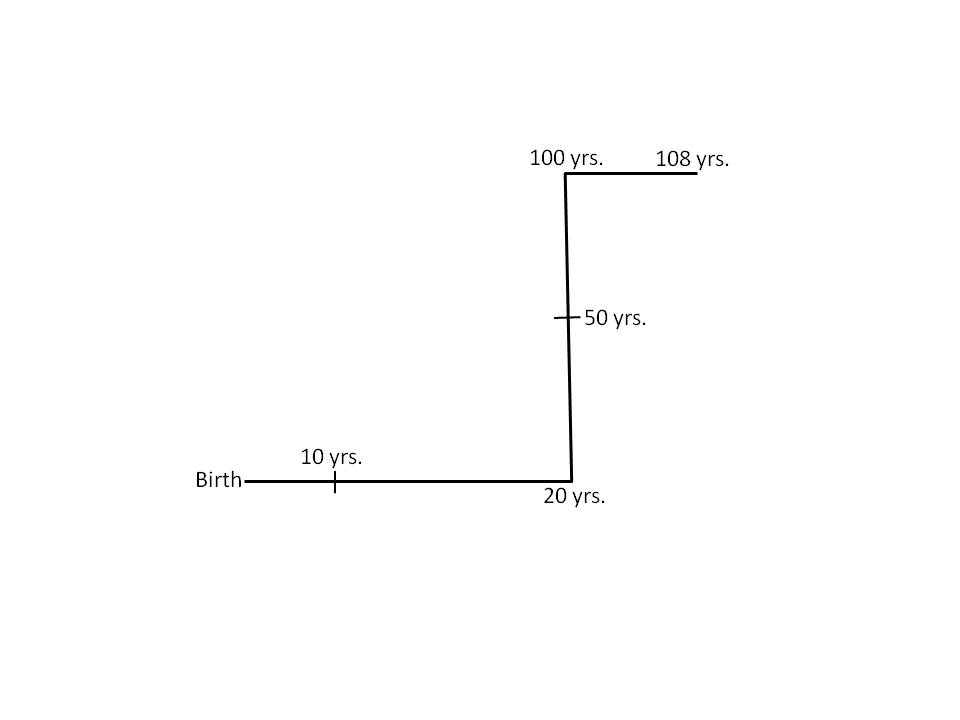
You will note that this mental image is similar to the previous one, but rotated 90° to the right. The scale is also warped: not only in the location of 50 yrs., but in the location of 10 yrs. I believe this stems from my childhood belief that the years from age 10 to age 20 would seem to last longer than the years from 0 to 10.
Why childhood? Well, I’ve had such mental images for as long as I can remember; it follows that they were first “constructed” in my brain at an early age. And there is a sort of logic to the idea that 10-20 lasts “longer” than 0-10. After all, we don’t normally recall anything about our first 5 years or so; to a child, it’s almost as if you missed those years. So if I am 10 years old, say, and looking back at my life so far, it won’t seem nearly as long as the decade looming in front of me. (I must stress that I am not a neuroscientist and that this is all pure speculation.) As for why 50 is half-way between 20 and 100, I can only conclude that I wasn’t so good at calculating averages when I was younger. The similarity of the two mental maps is best explained by positing that one of the maps is derived from the other, although which came first I cannot say.
But still, that kink…
I only became aware very, very recently that there is a name for this phenomenon. These maps I make are called “number forms” and they are a form of synesthesia. I have a friend who experiences grapheme-color synesthesia, seeing letters and numbers as if they had very specific colors. It never occurred to me that my mental number maps were a related phenomenon in any way.
Here’s how I see the months of the year:
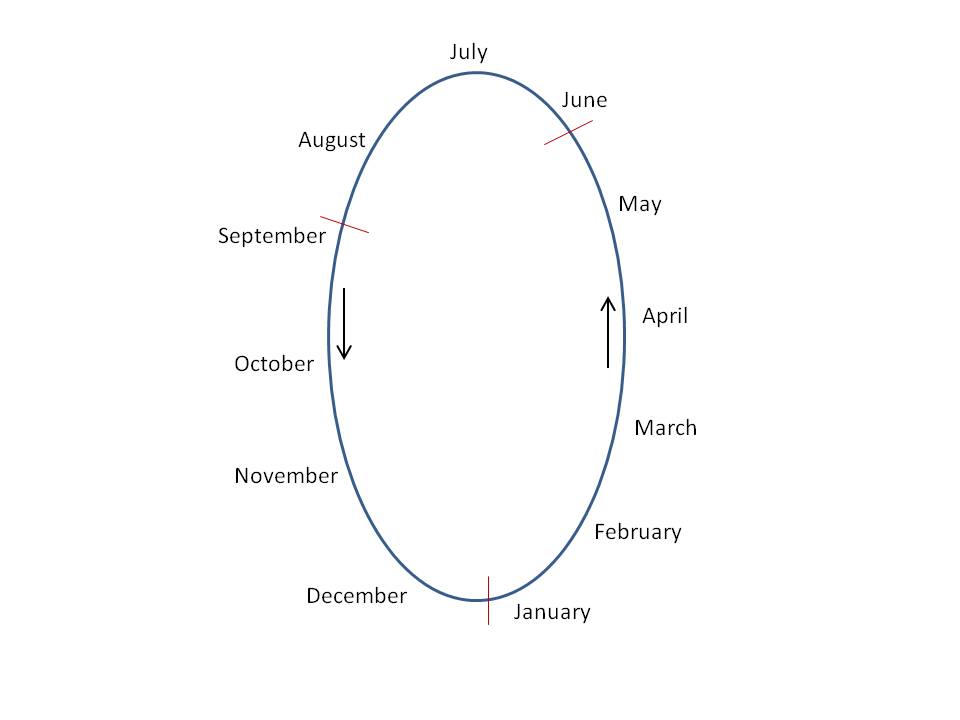
The order is always counterclockwise. Strangely, the months are not quite evenly distributed: July is always at the top, but December/January are level at the bottom, with the (strange) consequence that there is one more month in the first “half” of the year than the second. I also mentally divide the year into three partitions, starting at Sept. 1, Jan. 1, and June 1. I am confident that this partitioning is a product of having attended school (on a semester system) for 25 years of my life.
Here’s the strangest map of all, but one that has (I think) the easiest explanation:
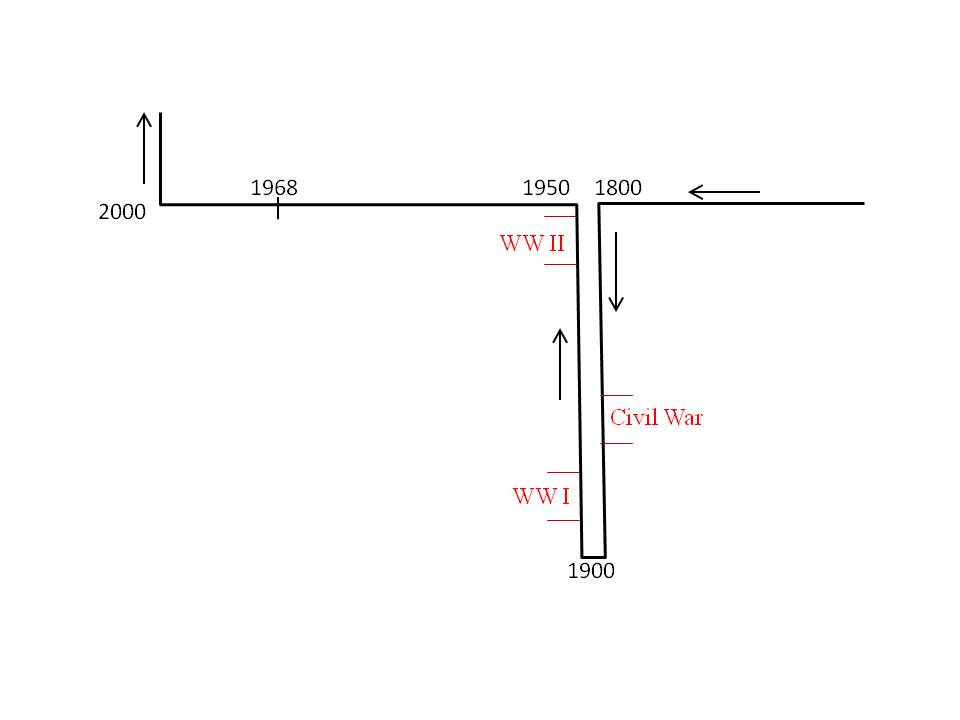
This is how I picture the recent history of the world, from the late 1700’s to the present. There are four kinks: at 1800, 1900, 1950, and 2000. The three biggest wars (to an American, at least) are marked in red; 1968 is also clearly “labeled” in my mental map (obviously because it’s the year of my birth). Again, there is a lack of scale: 1800-1900 takes up as much “space” as 1900-1950. One might conclude that I regard the 20th century as more “important” than the 19th, since I relegate more space to the former. But there is a simpler explanation.
I can still vividly recall a timeline of history that I saw, perhaps in the 3rd or 4th grade, that has the exact same topology as this last mental map of mine. The years from 1800 to 1970 (or so) were graphically depicted in a timeline; there were folds at 1900 and 1950, simply to make the timeline fit on the printed page. Above key years (such as 1939) were cartoonish drawings of world events, such as World War II or Man Lands on the Moon. Beyond the 1970’s there was nothing. I wish I could find this image, which I believe in some sense “triggered” this form of synesthesia; I want to say that the image was in a World Book Encyclopedia but I have no proof of this claim.
In any case, I think other forms of synesthesia may also be linked to the way we first learn certain things. My friend (who sees colors for every letter of the alphabet) once told me the probable origin of his synesthesia. He first learned letters and numbers through colored refrigerator magnets; the colors and letters became inextricably tied in his mind, and the connections exist to this day. For any real neuroscientists out there, I believe this is a fruitful area for further research.
Anyway, I’d be curious to see how many other people experience “number forms”. It doesn’t make you crazy. After all, Sir Francis Galton called his book on the subject The Visions of Sane Persons.
But still, that kink…

I don’t have “number forms” but I do play some kind of “mental animation” when I do calculus. Like the derivative or integral operator “hits” the function and makes it change to something.
I also have this compulsion to add up “modulo 9” any stream of integers I find: clocks, dates, number plates, anything goes. I’m at this point where I can’t stop myself and, if I see 8 + 4 I will think “3”, not 12.
Guess we all have our quirks…
I kinda loved this, especially your musings on why and when it began. I’ve had the same colors for numbers and letters now for 60 years. Only put a name to the curse/blessing recently. Before that it was just my private and undiscussed ‘weirdness’.
As to spatial charts of numbers, big Hmm.. It’s quite possible that I have those models, but never turned around to look at them, like a fish doesn’t feel wet. I’ll give it some deep reflection.
Oh, and specifically, a teaching tool in my old one-room school in the early 50s did include coloring in numbers, and I can attest that 8 was as yellow as they come, as it is now in my pantheon.
So there’s a potential for understanding triggers there, once the propensity is genetically determined.
And one final mystery, while we’re viral, ha. how does it happen that the resistor color-code (marked bars on the component, is an all-but perfect recitation of my own numbers.I first met resistors only at like, age 9, by which time everything personal was long-since set in stone.
(Sorry for the long-winded-ness, but your rigorous inquiry here is a rare treat. JS tel Aviv
I think it has to do with the way we process and store information. We especially interpret peaks of information, things that are “interesting”, “meaningful”. The number line, for example: when we’re little we first learn to count to ten, then twenty; after we’ve understood how to do it, the rest is “rinse and repeat”. I think self similar information is compressed for storing.
The timeline makes even more sense interpreted this way. Try to imagine 50 years, 200 years, and then 200 mln. 50 should be almost equal in length to 200, then 200 mln will probably be shorter (for me it is). I can enumerate lots and lots of things that happened in the past 50 years, just as many things that happened in the past 200 but when it comes to 200 mln I can only think of dinosaurs. And more dinosaurs. And more di… well, point made, I guess. The length of the line is proportional to the quality of the information related to it. The bigger the amount of time without relevant information, the more difficult to wrap your head around how long it actually means.
It should be surprising the number line is not even more disproportional, but that’s likely due to logic which indicates that 20 should not equal 100.
I also have a kink at 20. It’s closer to a 30 degree turn, going from a straight vertical climb in the teens to an upward left slant to 100. At 100, the form doubles back and curves upward and to the right toward 1000. 1000 to 1 million is identical, but in increments of 1000.
Interesting!
Interesting with the turn at twenty. I have it aswell, even though it does not turn 90 degrees, more like 80, to the left. At thirty it turns 10 degreees to the left again, until 40, where it slowlys turns 90 degrees to the right. The path to 100 is fairly straight, but inclined towards the right. At 100 it turns left about 90 degrees.
I have a fairly detailed picture of where numbers are up to around 10*10^15.
Thanks for an interesting post!
My number form is very strong when it comes to the 20th Century. I see the the years in a chain that can change direction with each decade, sometimes at 90deg angles and are in 3D space. The decades I see strongest are the ones going left – to – right. So the 1930’s appear stronger than the Forty’s which run at 90 degrees with 1949 visually closer to me than 1940. Some years I see with a sense of colour, almost invoking a sense of hot or cold. 1939 is a grey, blue, cold year like 1968 whereas 1983 is a warm, yellow and orange colour.
I have similar forms to you. My number form is like your age form and my year form is like yours but mirror image (mine is clock wise). Maybe we were in the same elementary school class, haha.
Fairfax County Va. in the mid-70’s?
I’m actually so interested in this topic that I’m thinking about doing a project about it: I’m not a neurologist, I’m a graphic designer, and I’d approach the theme in a more social-input way.
My number form has hot spots like yours, a turn at 10, a light one at 20, one at 100 and one at 1000. But I feel it’s a whole environment, it could be best represented with a 3d model of the flow of the numbers with the point of view costantly moving along with the number I’m visualizing.
The area with the first numbers is way bigger (the point of view is more near to the numbers). And moving along the hundreds the point of view is more and more far away.
This could imply, as someone said here, the fantasy we were using when we first learned about the numbers. This happens to me also with months, years (whole huge flow/model of the history+nowadays) week days, and in a more blurred and light way with songs structures (especially when I learn the patterns and the structure of them, playing drums).
I’d love to visualize these spaces, these mental graphic organizations. I think graphic design could have a lot to learn from this istinctive and primordial way of organizing abstract data, and analyzing this in a more visual way (rather than neurological) could bring new solutions to the discipline of visualization.
Great idea! I’d be happy to share any of your visual “creations”.
I just deepened my thoughts in a post on my blog, here: http://jacopoatz.tumblr.com/post/77078124174/about-the-number-form
Wow, you are my spatial forms soul mate! Seriously, I can’t believe it! My number form is kind of a mirror version of yours. It goes up from 0 to 20 and then to the RIGHT until 100, where it goes up until 120 and so on.
And my year looks exactly like yours. It also has December and January on the bottom, runs counterclockwise AND it also has seven months (January to July) in the first half of the year and the remaining five in the second half.
Nice!
Can you tell me if I have Synesthesia?
My number form is just a basic map like that of a number chart of 1-100. (http://www.enchantedlearning.com/math/hundred/100.GIF ). It’s not as square as in the picture but rectangular streched from left to right. Whenever I think or see or hear a number say 72, I find myself looking at position of 72 in that imaginary chart below 71 and above 73 and other numbers. There are also checkpoints like 12(clock), 24 (24 hours). I see months going down to bottom and i see them in words (JANUARY, FEBRUARY….). When I come across a date like Aug 15 I zoom in (concentrate) on AUGUST and I see 1- 31 in the same rows and columns. So I look at 15 being in its position surrounded by the other numbers in their orders. Same thing with the days in a week. Whenever I hear, see or think of a day I look at it being in its position along with other days like if I think of Wednesday, I see Sunday, Monday, Tuesday, above it and the others below. So do I have Synesthesia?
Sorry that image url is wrong. It has 1-10 in a row. What I wanted was a pic with 1-10 in a column
And I forgot to tell that I also see years in the same format. And when it comes to 1-100,000 and above, I see 1-99999 on left side with 100,000 being on top on right (in position of 1) and 1 Million below (in the position of 10) and 10 Million in position of 100.. Somehow I can’t seem to edit the posts..
This is weird, but I have the exact same model as yours. Infact I do most of arithmetic by adding and subtracting blocks from this giant grid of numbers. Similar to 100000 and million, I see 10 million at top right, 10 billion at 1 position and see max to 1 trillion.
love this….thought I was the only one. My number line has a 90 degree turn at 20
my “dateline” is straight until the year of my birth (1970) and takes a 90 degree turn at each change of decade
I have this exact same model in my head too, except my numbers for ages is slightly different. I’m so glad other people have this too! I try to explain it to my family and no one understands.
I just stumbled across this and I can’t believe it. I’ve had this all my life and I didn’t know that not everyone thinks this way. What really got me is the months. Mine are similar(in an oval shape) but go clockwise and like you are not evenly distributed. I’ve actually asked people how they picture there’s. They must think I’m crazy but now I know I’m not (well, not about this at least). 🙂
Matthew, I also only discovered not everyone thinks like this a few weeks ago. I really relate to your story.
I wrote my story and drew my number lines here. mynumbermap dot com.
Years or decades in history have colors and specific personalities for example 1917 is Brown with stressful personality And 2017 is green and white with a boring and improve others year and My number map of the 18s only 18-Red 1018-Black 1118-Red 1218-Red 1318-Green 1418-Blue 1518-Yellow 1618-Black 1718-Brown 1818-Blue 1918-Brown and 2018-Orange/Red
My numbers 0,Blue 1,Black 2, Orange 3, green 4, Blue 5,Dark pink 6, Pink and Violent 7, Violent 8, Blue 9, red 10- 19- Red 20-29- Violent 30-39 are green etc.
I never thought about it until I saw this that my age numbers are also in a different form than my number line! The first year (0-1yr.) is counterclockwise like my calendar, then 1-20 run West to East where it takes a right turn and goes South to 120, and there are curved lines marking decades. It has some similarities to a portion of my historical timeline, but doesn’t quite line up and doesn’t have the square tunnel shape that my timeline has.
My regular number line is 1-10 in front of me going left to right, then it makes a right turn and 11-1000 are beside me on my right and running past me, then it makes another right turn and numbers over 1000 go behind me and off to my left in an interminable line (and I feel better if I’m facing East so the endless line runs off to the North, but that may be because my early elementary school desks all faced East). There is a lot more detail about the weird spacing, but that’s the general look of it.
All my forms (weeks, months, temperatures, hours, etc. are tied to ordinal directions in some way, and most are on a horizontal plane.
Thank youu for writing this
I once was involved in a family blow up over this subject. Most of us had some form of visual layouts for numbers, days of the week, months of the year, etc. Two family members got very angry because they couldn’t understand the concept. Strange.