Last week I had a post go viral. My hits went into the stratosphere, and traffic to my blog went up by a factor of almost 1,000. I know this is my 15 minutes, and they’re fading fast. So, while I still have some elevated traffic, I thought I’d re-blog a few older posts, to see what happens.
Number form synesthesia or: why is there a kink at 20?
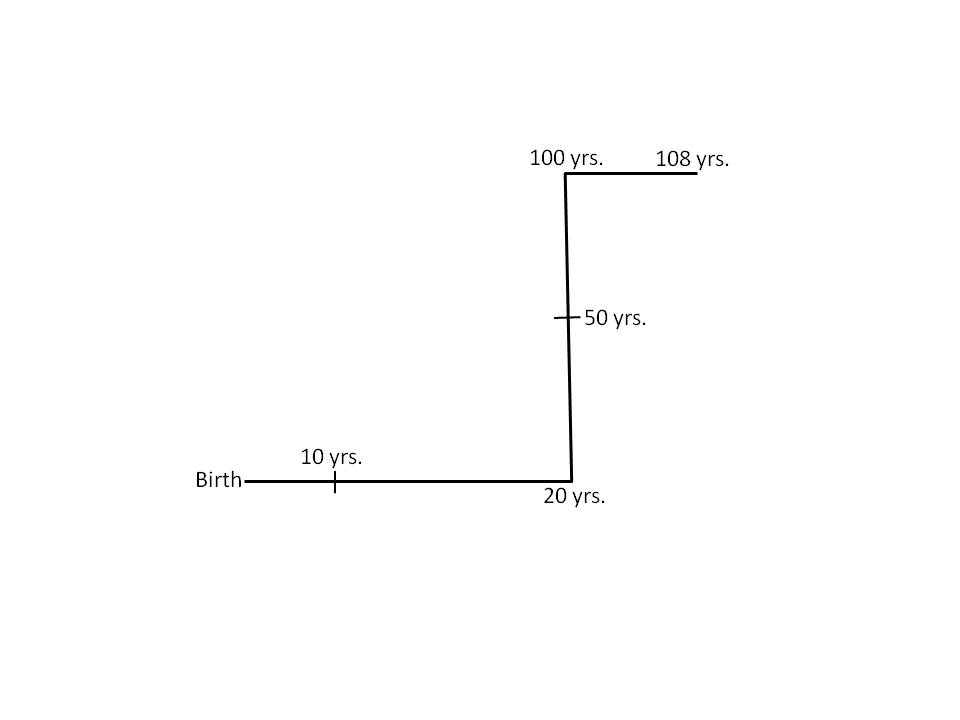
Whenever I think of numbers, I form a mental image in my head. This is not a conscious process; it happens consistently and involuntarily. For example, whenever I imagine the numbers 1 through 100, I see something like this:

You will note several interesting features of this mental map. Firstly, there is always a 90° left turn at the number 20; there is always a 90° right turn at the number 100. These two kinks are the only kinks in my mental number line; the lines are perfectly straight before zero and after 100. Why the kinks are there is mysterious.
Notice also that the image is not to scale. That is, 50 occurs half-way between 20 and 100 (why isn’t 60 there instead?)
Here’s another mental map I have, one that appears whenever I imagine a person’s age:
You will note that this mental image is similar to the previous one, but rotated 90° to the right. The scale is also warped: not only in the location of 50 yrs., but in the location of 10 yrs. I believe this stems from my childhood belief that the years from age 10 to age 20 would seem to last longer than the years from 0 to 10.
Why childhood? Well, I’ve had such mental images for as long as I can remember; it follows that they were first “constructed” in my brain at an early age. And there is a sort of logic to the idea that 10-20 lasts “longer” than 0-10. After all, we don’t normally recall anything about our first 5 years or so; to a child, it’s almost as if you missed those years. So if I am 10 years old, say, and looking back at my life so far, it won’t seem nearly as long as the decade looming in front of me. (I must stress that I am not a neuroscientist and that this is all pure speculation.) As for why 50 is half-way between 20 and 100, I can only conclude that I wasn’t so good at calculating averages when I was younger. The similarity of the two mental maps is best explained by positing that one of the maps is derived from the other, although which came first I cannot say.
But still, that kink…
I only became aware very, very recently that there is a name for this phenomenon. These maps I make are called “number forms” and they are a form of synesthesia. I have a friend who experiences grapheme-color synesthesia, seeing letters and numbers as if they had very specific colors. It never occurred to me that my mental number maps were a related phenomenon in any way.
Here’s how I see the months of the year:
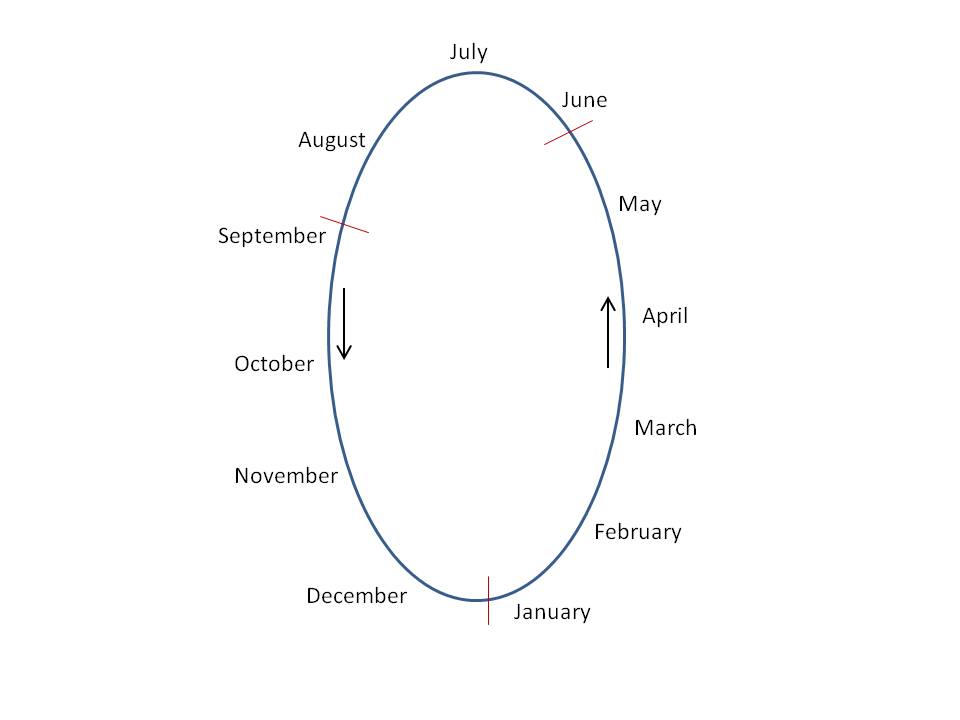
The order is always counterclockwise. Strangely, the months are not quite evenly distributed: July is always at the top, but December/January are level at the bottom, with the (strange) consequence that there is one more month in the first “half” of the year than the second. I also mentally divide the year into three partitions, starting at Sept. 1, Jan. 1, and June 1. I am confident that this partitioning is a product of having attended school (on a semester system) for 25 years of my life.
Here’s the strangest map of all, but one that has (I think) the easiest explanation:
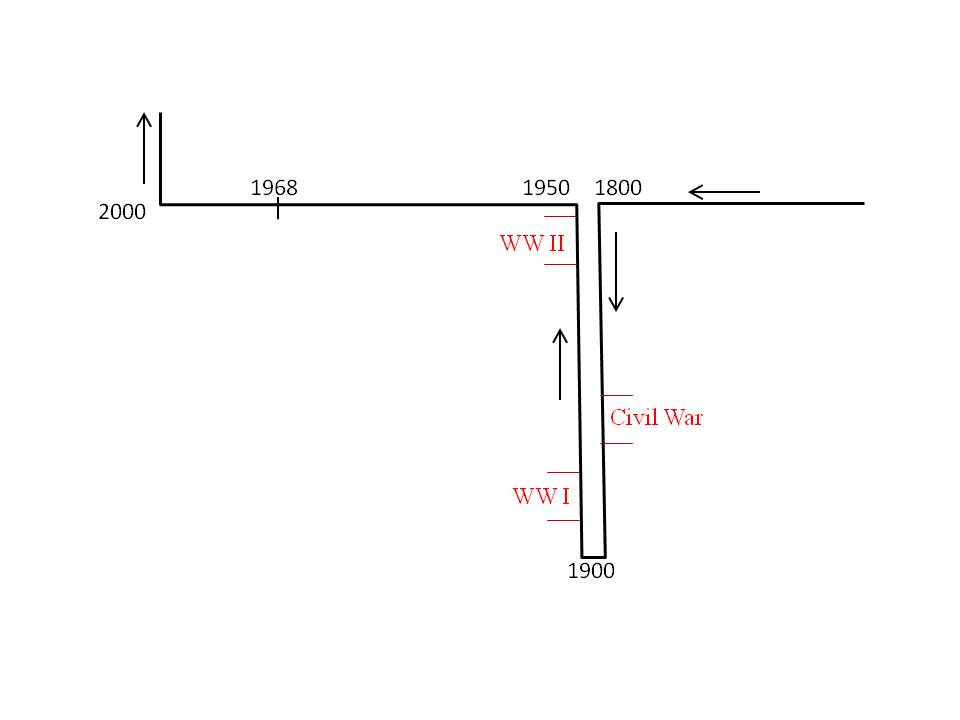
This is how I picture the recent history of the world, from the late 1700’s to the present. There are four kinks: at 1800, 1900, 1950, and 2000. The three biggest wars (to an American, at least) are marked in red; 1968 is also clearly “labeled” in my mental map (obviously because it’s the year of my birth). Again, there is a lack of scale: 1800-1900 takes up as much “space” as 1900-1950. One might conclude that I regard the 20th century as more “important” than the 19th, since I relegate more space to the former. But there is a simpler explanation.
I can still vividly recall a timeline of history that I saw, perhaps in the 3rd or 4th grade, that has the exact same topology as this last mental map of mine. The years from 1800 to 1970 (or so) were graphically depicted in a timeline; there were folds at 1900 and 1950, simply to make the timeline fit on the printed page. Above key years (such as 1939) were cartoonish drawings of world events, such as World War II or Man Lands on the Moon. Beyond the 1970’s there was nothing. I wish I could find this image, which I believe in some sense “triggered” this form of synesthesia; I want to say that the image was in a World Book Encyclopedia but I have no proof of this claim.
In any case, I think other forms of synesthesia may also be linked to the way we first learn certain things. My friend (who sees colors for every letter of the alphabet) once told me the probable origin of his synesthesia. He first learned letters and numbers through colored refrigerator magnets; the colors and letters became inextricably tied in his mind, and the connections exist to this day. For any real neuroscientists out there, I believe this is a fruitful area for further research.
Anyway, I’d be curious to see how many other people experience “number forms”. It doesn’t make you crazy. After all, Sir Francis Galton called his book on the subject The Visions of Sane Persons.
But still, that kink…
