Up until Oct. 7, 2013, my modest blog averaged about 18 hits per day. Then this happened:

A post of mine, the 9 kinds of physics seminar, had gone viral. I was shocked, to the say the least.
I spent some time investigating what happened. The original post went out on a Thursday, Oct. 3. Nothing much happened, other than a few likes from the usual suspects (thank you, John Zande!) I did share the post with Facebook friends, which include not a few physicists. (Note: I don’t normally share my blog posts to Facebook.) Then on Monday, Oct. 7, the roof caved in.
It started in India. Monday morning, I had over 800 hits from India. My initial thought was that I was bugged somehow. But soon, hits started pouring in from around the world, especially the USA.
And then it kept going.
On Tuesday, Oct. 8, the Physics Today Facebook page shared the post, where (as of today) 451 more people have shared it, and 188,000 people have liked it. (Interesting question: my blog has only had 130,000 views. Are there really that many people who like Facebook posts without even clicking on the link?)
The viral spike peaked on Wed., Oct. 9. I had discovered by then that my post had been re-blogged and re-tweeted numerous times, by other physicists around the world. If you Google “The 9 kinds of physics seminar” you can see some of the tweets for yourself.
Why did the post go viral? Who knows. I’m not a sociologist. I think it was a good post, but that’s not the whole story. More importantly, the post was funny, and it resonated with a certain segment of the population. If I knew how to make another post go viral, I’d do so, and soon be a millionaire.
What’s fascinating to me, though, as a math nerd, is to examine how the virality played out mathematically. Here’s how it looked for October:

I don’t know anything, really, about viral cyberspace, but this graph totally matches my intuition. Note that for the last few days, the hits have been around 400/day, still much greater than the pre-viral era.
After the spike, is the decay exponential? I’m not a statistician (maybe Nate Silver could help me out?) but I do know how to use Excel. Hence:

The decay constant is 0.495, corresponding to a half-life of 1.4 days. So after the peak, the number of hits/day was reduced by 1/2 every 1.4 days.
This trend didn’t continue, however. Let’s extend the graph to include most of October:
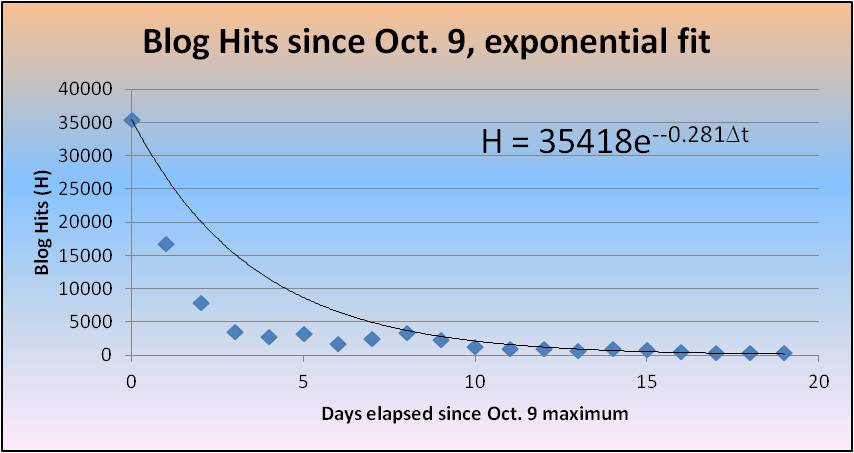
Over this longer time span, the decay constant of 0.281 corresponds to a half-life of 2.5 days. The half-life is increasing with time. You can see this by noticing that the first week’s data points fall below the exponential fit line. It’s as if you have a radioactive material with a half-life that increases; the radioactive decay rate goes down with time, but the rate at which the number of decays decreases is slowing down. (Calculus teachers: cue discussion about first vs. second derivatives.)
Maybe this graph will help:

The long-term decay rate seems to be 0.1937, corresponding to a half-life of 3.6 days. At this rate, you would expect the blog hits to approach pre-viral levels by mid-November. I doubt that will happen, since the whole experience generated quite a few new blog followers; but in any case, the graph should level off quite soon. What the new plateau level will be, I don’t know.
Where’s Nate Silver when you need him?
**********************************************************************************
If you enjoyed this post, you may also enjoy my book Why Is There Anything? which is available for the Kindle on Amazon.com.

I am also currently collaborating on a multi-volume novel of speculative hard science fiction and futuristic deep-space horror called Sargasso Nova. Publication of the first installment will be January 2015; further details will be released on Facebook, Twitter, or via email: SargassoNova (at) gmail.com.

Hi Matthew, I came to your post after a postdoc in my group twitted about it. Now you know the source of 2 out of 2296 hits from Germany!
Still 2294 to determine!
I believe it was the perfectly sharable post – I have also “automatically” shared it immediately on Twitter, Facebook and G+ – and I rarely do this (to share anything simultaneously on all networks).
I guess it was a good combination of easy read and lots of images (lending themselves to look nice and understandable also as a preview in shares on social networks) on the one hand, but a nerdy appeal to a smart target audience on the other hand.
Since I have seen you post being retweeted by some science writers I follow. Thus I guess you have some new followers now in particular in this community – which includes some very savvy re-sharers of anything geeky and sciencey. I have also seen that later posts of yours have been re-shared by science writers.
Thanks, Elke…I’d be curious to know what OTHER posts have been re-shared. It’s not always easy for me to figure it out from WordPress’s cryptic data.
The HR diagram of undergrads has also definitely been re-shared (I can’t recall the others).
Hopefully the viral post expanded your base from 18 to 400, which should make it easier to get another viral post sometime. Eventually everyone will know the Rave Theorem, which paradoxically will probably make it less effective …
Somewhere I have a list of games that violate the Rave Postulate. I think there’s like 4 or 5 games total that I have ever found. Out of maybe 50,000 bullet games, I think maybe I’ve lost twice after having the rooks on the 7th (although draws are much more common)
Maybe the equation should look something like:
hits = base + exp (-lambda t), where base could be a linear function of time with a very small negative slope. In fact, something like this could work:
base = number of total followers x (empirically determined constant) – slope x t, where you could easily determine the slope by subtracting the exponential decay and then using a linear regression. It’s simpler than having a lambda that depends on t!
You know, you could ask other bloggers that have had viral posts for their data and actually publish something about this on Arxiv.
Good idea…I thought about working this up in a more rigorous way but I don’t have any context for the data…that is, I don’t know WHY it would be exponential with a small linear piece. The theorist in me wants to have some EXPLANATION for the way the data is what it is…I suspect we’re talking about the way social media spreads, the speed of meme propagation in cyberspace, and so on, but I don’t know about any of that stuff. I would hope that someone has already looked into this…perhaps someone has written about the Gangnam style phenomenon, or What Does the Fox Say? or something similar. Anyway, if it ever happens to me again I’m going to keep meticulous notes and compare the two situations to see if they are mathematically the same.
That’s awesome… and you’re welcome. I like your blog. When you get a chance can you check out my most recent post on retrocausality and let me know if i’ve got it right? Retrospectively thinking, i probably should have asked you before… but then again, maybe i have and this is isn’t really happening right now. Oh dear, i feel entangled 😦
I’d like to brag right here that my only appearance in Wikipedia, anywhere, is in one of the references for retrocausality…see if you can spot it!
Rave, M. J. (2008). “Interpreting Quantum Interference Using a Berry’s Phase-like Quantity”. Foundations of Physics 38: 1073–1081. Bibcode:2008FoPh…38.1073R. doi:10.1007/s10701-008-9252-y.
Haha! Damn, I really should have consulted you first!
Congrats! First time visitor, but I will be sure to peruse and follow from now on. Though it seems like most of this will be over my head.
Quite amazing.
My publisher experienced a similar thing ( though not quite the same figures!) last year and she was ecstatic.
However…it turns out that a second-hand auto parts dealer in Russia was piggybacking her website! She was more than a tad miffed but I thought it was hilarious.
Ah..the joys of the internet.
I”ve yet to go viral, but maybe bacterial. Or fungal.